


Table of Contents
Cross-Sensitivities
The influence of other gases on the measurement result of an analyzer for a specific component is referred to as cross-sensitivity. The causes of this measurement error can vary greatly. Absolutely selective gas analyzers that respond solely to one measurement component and disregard other components in the gas mixture are practically unavailable. The influence of these interfering gases must be quantified for comparison purposes. The formal calculation of cross-sensitivity Q is performed according to:

Cross-sensitivity is thus the ratio between the two readings, A₂ of the interfering gas and A₁ of the measured gas, each divided by their respective gas concentrations c₁,₂ (Hengstenberg 1980). Q is a dimensionless quantity used solely for comparison purposes. Selectivity (S) is the reciprocal of cross-sensitivity.
Example: A gas analyzer produces an output voltage of 1 Volt at a concentration of c₁=10 Vol.-%. An interfering component with a concentration of c₂=100 Vol.-% generates an output signal of 125 mV. Therefore, the cross-sensitivity is:

Carrier Gas Dependency
Another type of cross-sensitivity is the carrier gas dependency of the calibration function when using different accompanying gases. Unlike cross-sensitivity, which manifests at the zero point in the presence of interfering gases, carrier gas dependency only appears in the output signal. Typically, the calibration function is recorded by adding a base gas (zero gas) to the measured gas. However, in practical applications, other components are present. These components can alter the calibration function due to physical effects. The most well-known effect is pressure broadening caused by other gases, leading to a change in absorption ratios in a photometer. When the concentrations of interfering components are in the ppm range, this influence is negligibly small. However, when concentrations rise to the double-digit volume percentage range, this effect can significantly impact the calibration curve. A typical example is the simultaneous measurement of CO₂ and CH₄ in a biogas plant. If the calibration curves for CO₂ and CH₄ sensors are determined using nitrogen as the zero gas, significant deviations will occur for a real biogas mixture. Therefore, calibration should be performed in the actual matrix encountered in practice to avoid these error influences. The figure shows the behavior for different concentration ratios:
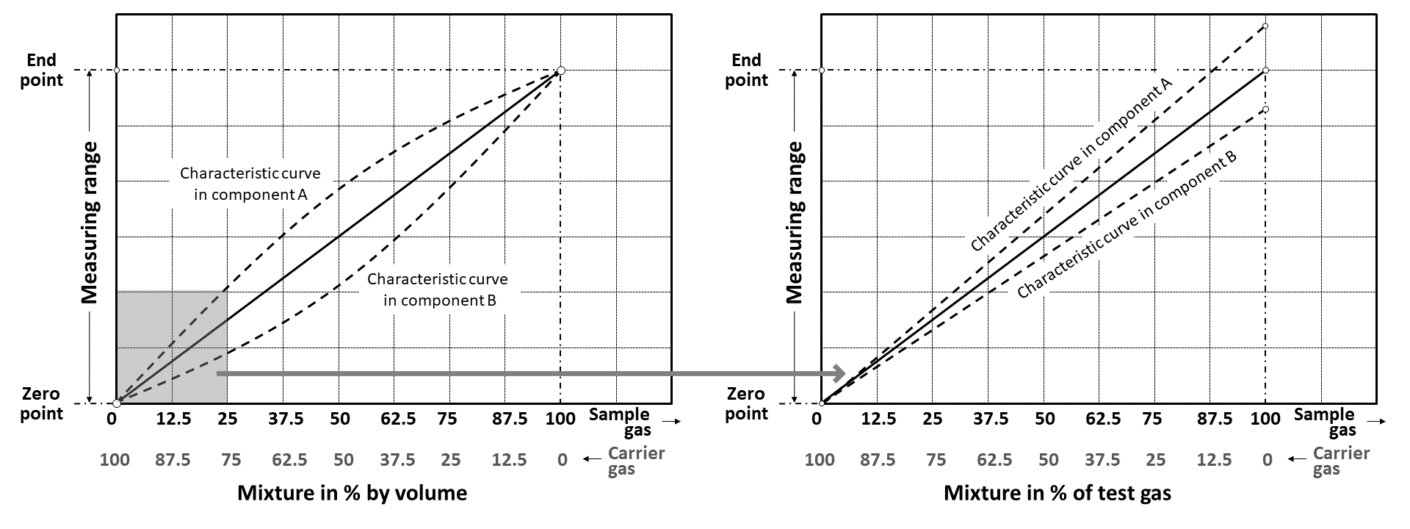
Author: Gerhard Wiegleb, »Gas Measurement Technology in Theory and Practice (Measuring Instruments, Sensors, Applications)« published by Springer